indoor-positioning

Table of Contents
Introduction #
This is a full-featured indoor positioning system that was developed during my master thesis. Its server component uses servlets and an Angular JS front end, whereas the Router/AP service is written in Lua.
Requirements #
Software #
- Java 11
- Tomcat 7
- CouchDB 1.5
- Maven 3
Hardware #
- At least 4 OpenWRT compatible AP/Routers in a network with provided custom web services
- At least 1 OpenWrt compatible AP/Router as client with provided custom web services
Architecture/Procedure #
The underlying architecture can be observed in the diagram below.
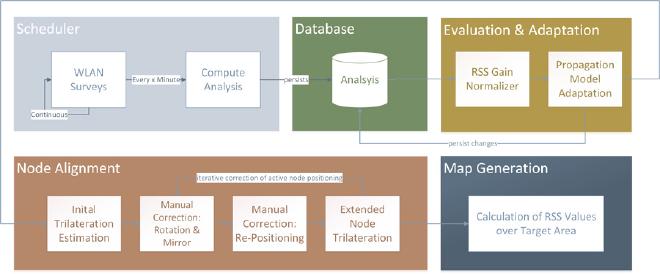
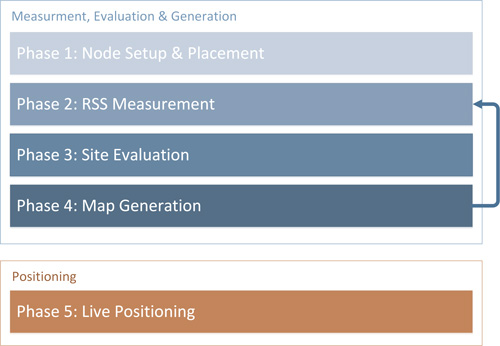
Overall procedure to map the target area:
-
Node Setup & RSS Measurement Active Nodes, which can be regular access points, are distributed among the target area. Next a measurement phase is initialized which takes about one to three hours.
-
Site Evaluation From the resulting data, the underlying radio propagation model can be adjusted to meet the actual properties of the current site.
-
Map Generation & Positioning With the adapted model, radio wave propagation can be simulated over a representation of the target area. Positioning works similar to the scene analysis approach using a modified nearest neighbor algorithm.
Setup #
Server #
Start Tomcat & CouchDB with standard ports. Compile project with
mvn clean package
and deploy the *.war on your Tomcat. The DB will be set up automatically, the name of the db will be derived from the
maven
AP/Routers #
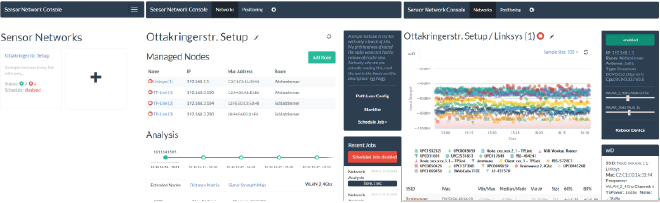
System Configuration #
As prerequisites, you must have at least 4 APs ready (with installed webservers) in your network (knowing the IPs of each).
Open the browser and enter the url you deployed the war (usually something like http://localhost:8080/MyProject). Create a new network by pressing the box with the “+”. Enter the details and set “Surveys Per Node to 100” and “Survey Schedule” to “Every Minute” to accelerate measurement. Then next to “Active Nodes”, add new nodes with “Add Node”. Enter name and IP address, then press “discover” to see if the node is reachable. After adding all nodes wait a couple of hours to let it measure.
Next press “Schedule Job” -> “Start Single Run Analysis” and wait a couple of seconds. The analysis should appear under “Analysis”, reload page if not. The click “Radio Path Loss Config” and click “Normalize Node Multipliers”. In the bottom table click on drop-down under “SSID” and choose “Targetdistance”. Add the physical distances between nodes in meters in the distance matrix or skip the entire step. After entering the distances you can press “Calculate Path Loss Model” to optimize the used model -> “Update config”.
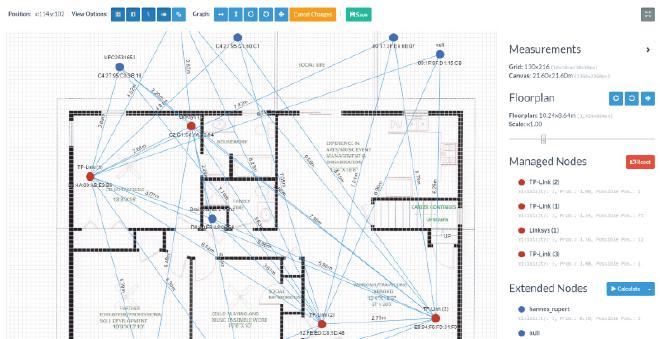
Next, again, press “Schedule Job” -> “Start Single Run Analysis” and wait a couple of seconds. Select the current analysis (with the adapted model). Choose “Signal Strength Map” and correct the positions of the active nodes. You may want to upload a floor plan blueprint first in the network details (the pen icon next to the main header). After that, go to map full screen mode (four arrows icon). Scale the floor plan with the slider until the meter sizes are correct (you may have to correct the positions of the Active Nodes again). Then press “Calculate” next to the “Extended Nodes” headers. This will calculate the positions of all APs/Routers in the vicinity. You may want to correct the positions you know of. Press “save”. You now are ready to position.
Positioning #
You need an AP with the custom webservices installed, same as Active Nodes. This AP must be in your network.
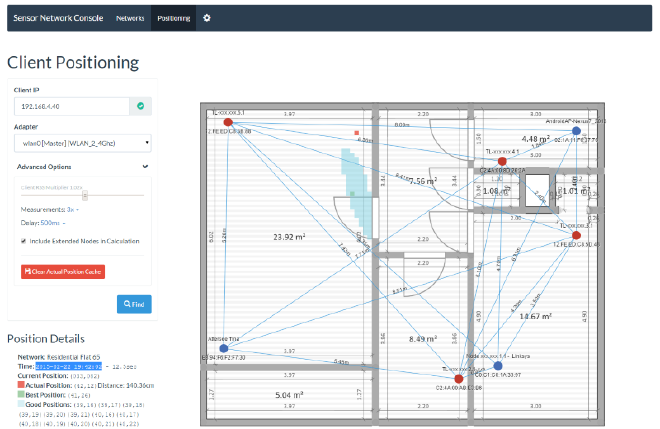
Go to “Positioning”. Input the IP of the client (AP) and press “Find”. If multiple networks match for this position you have to select one, otherwise you will be shown a UI with the estimated position. You may press on a square in the grid to select the actual position to let the system calculate the offset.
Performance #
Properties of the Proposed System
- Adapts well to the specific environment
- Good scalability and low maintenance with easy setup
- Accuracy between 2 and 4 meters on average (see diagram)
- Initial positioning with trilateration works well
- Quality degrades with non-correlating RSS
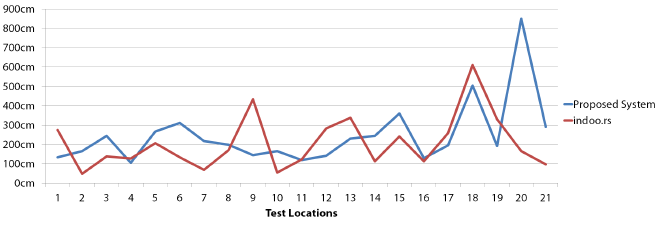
Accuracy #
The results indicate that the position accuracy offers a performance comparable to a state-of-the-art solution. The following diagram shows the accumulated offsets in all test locations.
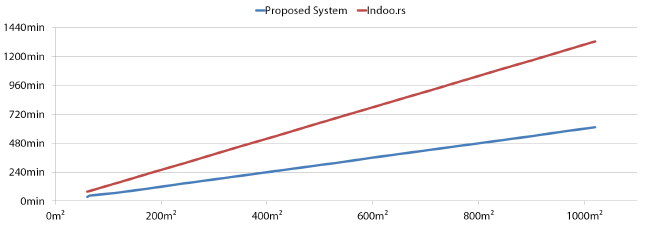
Scalability #
Based on extrapolated data, the proposed system delivers superior performance in terms of maintainability and scalability. In the diagram below the required effort for various target areas is depicted.
License #
Currently proprietary